Introduction
Most research into wild marine mammals occurs in wealthy countries. Amazingly, in 2018, we have still have very little idea what species are present, let alone the population size / health status / behaviour, etc. in many parts of the world. A solid first step to address this problem is to conduct a rapid assessment survey to determine which species of marine mammals are present in a given area.
The idea of a rapid assessment survey is fairly straightforward: you take a boat out and survey the entire coastline of a country using visual observers to record the number and species of any whales and dolphins encountered. As well as being large, surface present and often charismatic animals, and so possible to detect visually at relatively long ranges, dolphins and whales are also highly vocal, using sound to communicate and some species hunt/sense their surroundings with a sophisticated a bio-sonar. So, for most marine mammal surveys, it also makes sense to acoustically monitor the area we are visually surveying. We do this by towing a hydrophone (underwater microphone) array behind the survey boat. That way, if the sea is rough and the animals are difficult to spot, you can still detect the tell tale vocalizations of different species, and even localise their likely position.
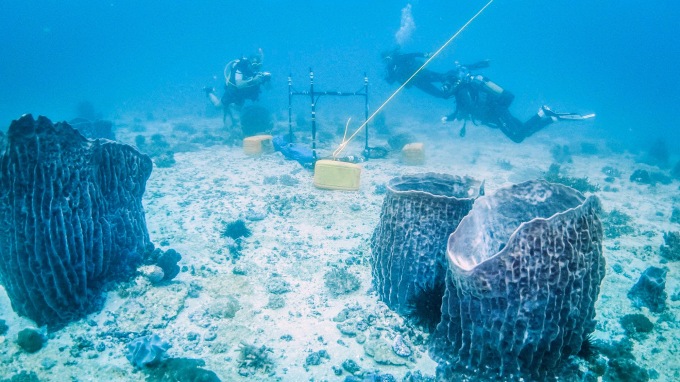
Back in 2015, I was part of a team led by Gill Braulik on a rapid assessment survey of marine mammals in off the coast of Tanzania. We used a combined visual and acoustic survey method to determine the species of whales and dolphins present, and their spatial distributions along the coast of Tanzania. The survey was a success, and you can find our publication on this here (Braulik et al. 2018).
However, during the analysis of the acoustic data it became apparent that there was a frequently detected loud “clapping” noise. After some investigation it became apparent that these were the long range acoustic signatures of illegal “blast fishing” – a fishing technique in which a bomb is thrown into the water to kill or stun fish, causing them to rise dead to the surface, and allowing them to be quickly and easily scooped up by fishermen.
The conservation implications of blast fishing include: indiscriminate killing of all species within the bomb’s range, damage to coral reefs, and significant noise pollution. We were looking for animals but discovered that our survey method also had the power to reveal how common illegal blast fishing was, and where it was happening. So we also produced another paper, this one focusing on the large number of bomb blasts that were detected. This got quite some traction in the press.

After the survey, other hydrophones detected the same thing: lots of bomb blasts. However, the acoustic detection of any bomb was still just opportunistic, as it was recorded in other projects which were not exclusively focused on addressing the conservation concern of blast fishing. It became clear that what was needed was a long term acoustic study which could locate the likely positions of each blast and quantify the full extent of the problem.
And so, in 2018, Gill Braulik, Code4Africa and myself teamed up to do exactly that. We deployed 4 state-of-the-art recording stations along the northern coast of Tanzania. The recording stations each have 3 synchronized hydrophones linked to a state of the art recording unit (SoundTraps), allowing us to work out a bearing to a received bomb blast. If 2 or more of the 4 stations picked up a blast, a latitude/longitude location can be determined. The recording devices are based on ultra low power acoustic devices and so can be deployed easily be a team of divers, something that’s really important where you don’t have access to specialized research vessels to deploy and recover gear. The project is ongoing, so they’re still out there recording bomb blasts and any/all other interesting sounds…
Acoustic Data Analysis
Recently we recovered the first set of recordings. 50 days of acoustic data on a 30 minute on/off duty cycle x 3 recovered stations= 75 days. How do we process that quantity of data on a very tight budget? Thankfully, there are some open-source projects out there to help us. The first stage was to process the acoustic data using PAMGuard . PAMGuard is great at quickly churning through large datasets and picking out interesting sections. The sound a bomb blast makes is low in frequency and lasts for a significant period of time (a second or so), and so we used the Ishmael detector and Clip Generator modules to save all high amplitude, long and low frequency sounds as 3 second ‘.wav’ clips. (Note the Ishmael detector is also available in the Ishmael software package). This worked great, with thousands of short audio clips of potential bomb blasts generated. However there’s a bunch of low frequency sounds on reefs and many of them are not bombs. For example…
So the next stage was to determine how to find which clips contain actual bomb blasts? With the recent advances in machine learning, it might initially seem sensible to train a neural net or other type of classifier to find bomb blast (i.e. to manually find some bombs for training data, train a classifier, and run it on the rest of the data). However there are a few issues with this. A classifier is only as good as it’s training data. So, that training data would have to be manually identified to begin with, which could be time consuming. In addition, this is very novel data. What if noise conditions change? What if there’s a species that starts vocalising during a different period of the year that confuses the classifier? To be diligent with the data analysis, even once the classifier has been trained, a manual analyst would have to check the classifier performance, at least for the first few years, by which time the project might be over. Having a manual analyst listen to all the clips form PAMGuard is also not an option, as it is still far too time consuming on a tight budget.
The solution is to a take a machine-assisted approach. Rather than training a machine to make decisions, we created highly interactive tools combined with machine learning to allow a manual analyst to always have the final say. This cuts the time it take to analyse large data sets by an order of magnitude (!) but maintains the valuable human oversight (we are, after all, still the best pattern recognition and decision making machines when it comes to bio-acoustics analysis!). Achieving this requires a first run machine learning application to group clips together, followed by a highly interactive application to allow a manual analyst to inspect the groups and annotate the data.
SoundSort. An app to quickly find bomb blasts
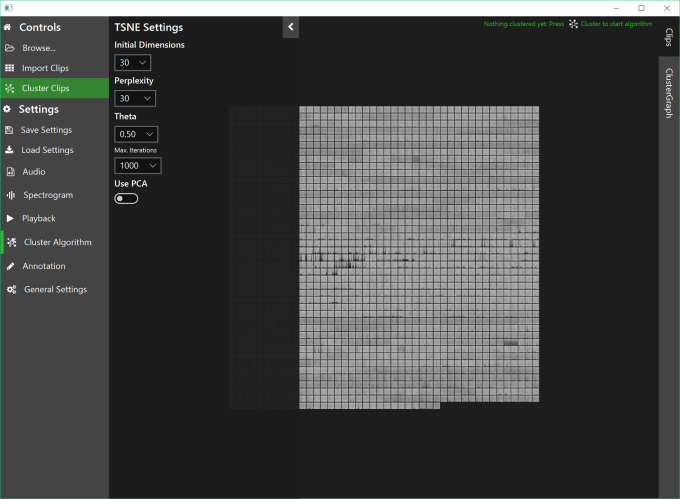
The machine learning aspect is actually quite easy (thanks to more clever folks who have figured this all out already), use t-SNE (T-distributed Stochastic Neighbor Embedding) to cluster spectrogram images. t-SNE can group similar spectrograms together. This has been done before with images, and even implemented for acoustics in one of Google’s AI experiments. Great! However although the machine learning methods exist to group acoustic data, the example code to do so is in Python, which is not very accessible to many marine biology researchers and nowhere near the interactive system envisaged.
So what’s required is an application that can presents the user with results in a similar way to Google’s AI experiments. JavaFX is a UI framework perfect for this task. It’s native, so can handle the graphics intensive tasks of drawing thousands of clips, and has a great set of third party libraries for additional user controls and styles. Plus it works on MacOS, Linux, PC, iOS and Android. This provided the perfect basis for building an application to perform t-SNE and allow a user to quickly and efficiently interact with the results.
Before getting to the app we built, SoundSort, it should be noted that building a program like this without an entire research budget is only possible because the efforts of the open source community. Even in this relatively simple application, there are multiple libraries used:
- A fast and native Java implementation of the t-SNE algorithm.
- The excellent controlsfx library for extra JavaFX bits and pieces.
- JMetro for styling the app with fluent design theme.
- FontawesomeFX for icons.
- javafxsvg for reading svg files.
- Apache Commons Math 3 for the fast Fourier transform and plenty of other useful functions.
- iirj for filtering acoustic data before decimating.
- alg4 for the solving the assignment problem, i.e. taking clustered points from t-SNE and assigning them to a grid.
- MatFileRW for writing and reading .mat files. This allows integration of the Java code with MATLAB/Octave.
SountSort is fairly simple to use. A user presses the browse button and imports a bunch of ‘.wav’ clips . They can decimate them to highlight the lower frequencies (if so desired) and choose the channel to use if the files are multi-channel.

The clips are presented on a grid. The user then clusters the spectrograms of all the clips using the t-SNE algorithm.
Once clustered, SountSort re-arranges the clips on the grid to correspond to clusters. The user can also see the raw cluster data.


Finally, the user can zoom in and out of the grid or graph and annotate the clips. The clustering means the user can quickly zoom into section of interest and annotate relevant clips. Clicking any clip plays the clip.
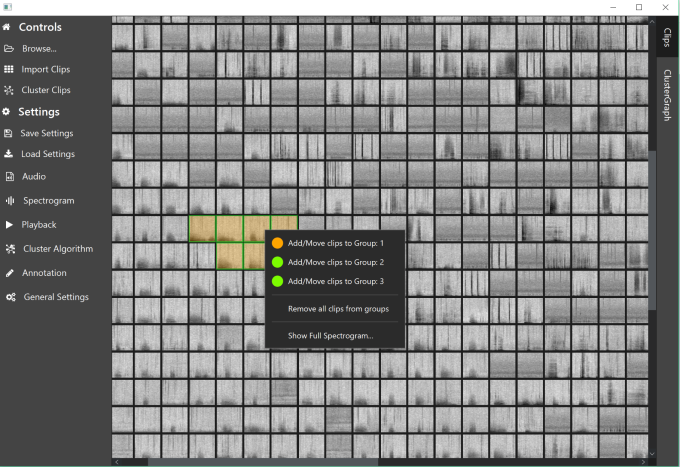
Once done with annotations, the user can export the annotated clips to folders named by the annotation group and/or export a ‘.mat’ file with program settings and annotations. We can then work out the bearings to bomb blasts and if two of our sensors pick up the same blast, cross the bearings to get a latitude/longitude location!
Results
Data analysis is ongoing SoundSort has already been used to find some blast fishing. Analysis for each listening station for each deployment should now only take a few hours maximum – a far cry from the 75 days per station we started out with!
^ What a fishing bomb blast sounds like.
More stuff to do and JavaFX 11
There’s plenty more work to do on SoundSort. One thing that would be great is to be able to get the application working with JavaFX 11, it’s now working on JavaFX 8. JavaFX 11 is separate library not included in the JRE and seems to be relatively easy to get going using Maven. However, there are several problems getting it working here, including that any library which has not been built with Java 11 and has an invalid auto generated module name cannot be used (t-SNE in this case). Plus a bunch of the controls in ControlsFX, such as the range slider, do not work properly and there seems to be some weird version exception. Might be a case of waiting a while for things to catch up but if anyone can get a Java(FX) 11 build working give me a shout on twitter!
Technically SoundSort should work with almost any type of sound, as long as it can be adequately represented on a spectrogram, e.g. tonal whale and dolphin tonal sounds, fish sounds, boat engines etc. (though not echolocation clicks). There’s also no reason small modifications could mean short sound snippets such as echolocation clicks couldn’t be fed directly into the algorithm or another type of transform (e.g. Wigner plot) used to represent the data. So there’s plenty of scope for expanding features and using this program in other projects.
Conclusion
By combing a highly interactive UI with human assisted machine learning, we can process large acoustic datasets quickly and on a shoestring budget, ideal for applications in environmental conservation projects.

Hi,
There’s a typo in the PAMGuard’s link.
Regards
LikeLike
Thanks. Should be fixed now
LikeLike
Hey, this is amazing work. Entertaining read, and such a cool research. Love the idea that went behind the creation of the app. I’m interested in using the app and seeing other potential uses as a classifier for other marine monitoring projects.
It seems like it could be very useful in all sorts of environmental and not environmental projects by helping to clump audio files that have similar characteristics, while retaining a good element of human control.
Very good approach, congrats !
Best,
LikeLike
Thanks! Unfortunately we didn’t ever get another project that required SoundSort but we are working on changing that!
I agree though that the key here is retaining an element of human control. In bioacoustics we just are not at the stage where we have super reliable classifiers (whether deep learning or not) and so having powerful visualization tools is critical for accurate and efficient data analysis.
LikeLike